NBA Analytics Project — Shot & Player Summary System
Abstract
This project implements a full-stack analytics workflow that mirrors a production-grade NBA data pipeline. The challenge: design a normalized PostgreSQL database, build a reliable ingestion process, expose structured player-summary analytics via a Django API, and then construct an Angular frontend that visualizes player shooting performance using accurate court-relative coordinates.
My solution integrates a well-designed relational schema, an idempotent ETL pipeline, a clean API architecture, and a modular Angular component that renders both summary stats and shot-chart overlays. The overall system reflects scalable engineering practices—including data validation, model-driven backend development, reusable TypeScript interfaces, and UI components aligned with modern frontend design principles.
Project Details
The assignment focused on three major deliverables:
1. Backend Engineering
- Normalize and store raw NBA-style player + shot data in PostgreSQL.
- Implement a repeatable ingestion script that loads raw datasets while preventing duplicates.
- Create an API endpoint (
PlayerSummary) that returns consolidated player information. - Export the final database state using
pg_dump.
2. Frontend Engineering
- Build an Angular component that consumes
/api/v1/playerSummary/{playerID}. - Visualize player shot charts using basket-relative coordinate systems.
- Create a TypeScript interface mapping exactly to the API response.
- Capture and upload UI screenshots demonstrating the component.
3. Environment Setup
- Configure PostgreSQL schemas and roles.
- Run Django backend using Pyenv + virtual environment.
- Start Angular frontend (Node 16 + Angular CLI 12).
My implementation unifies these steps into a robust, testable pipeline where each layer—the database, backend services, and UI—integrates seamlessly.
Backend Implementation
Database Architecture
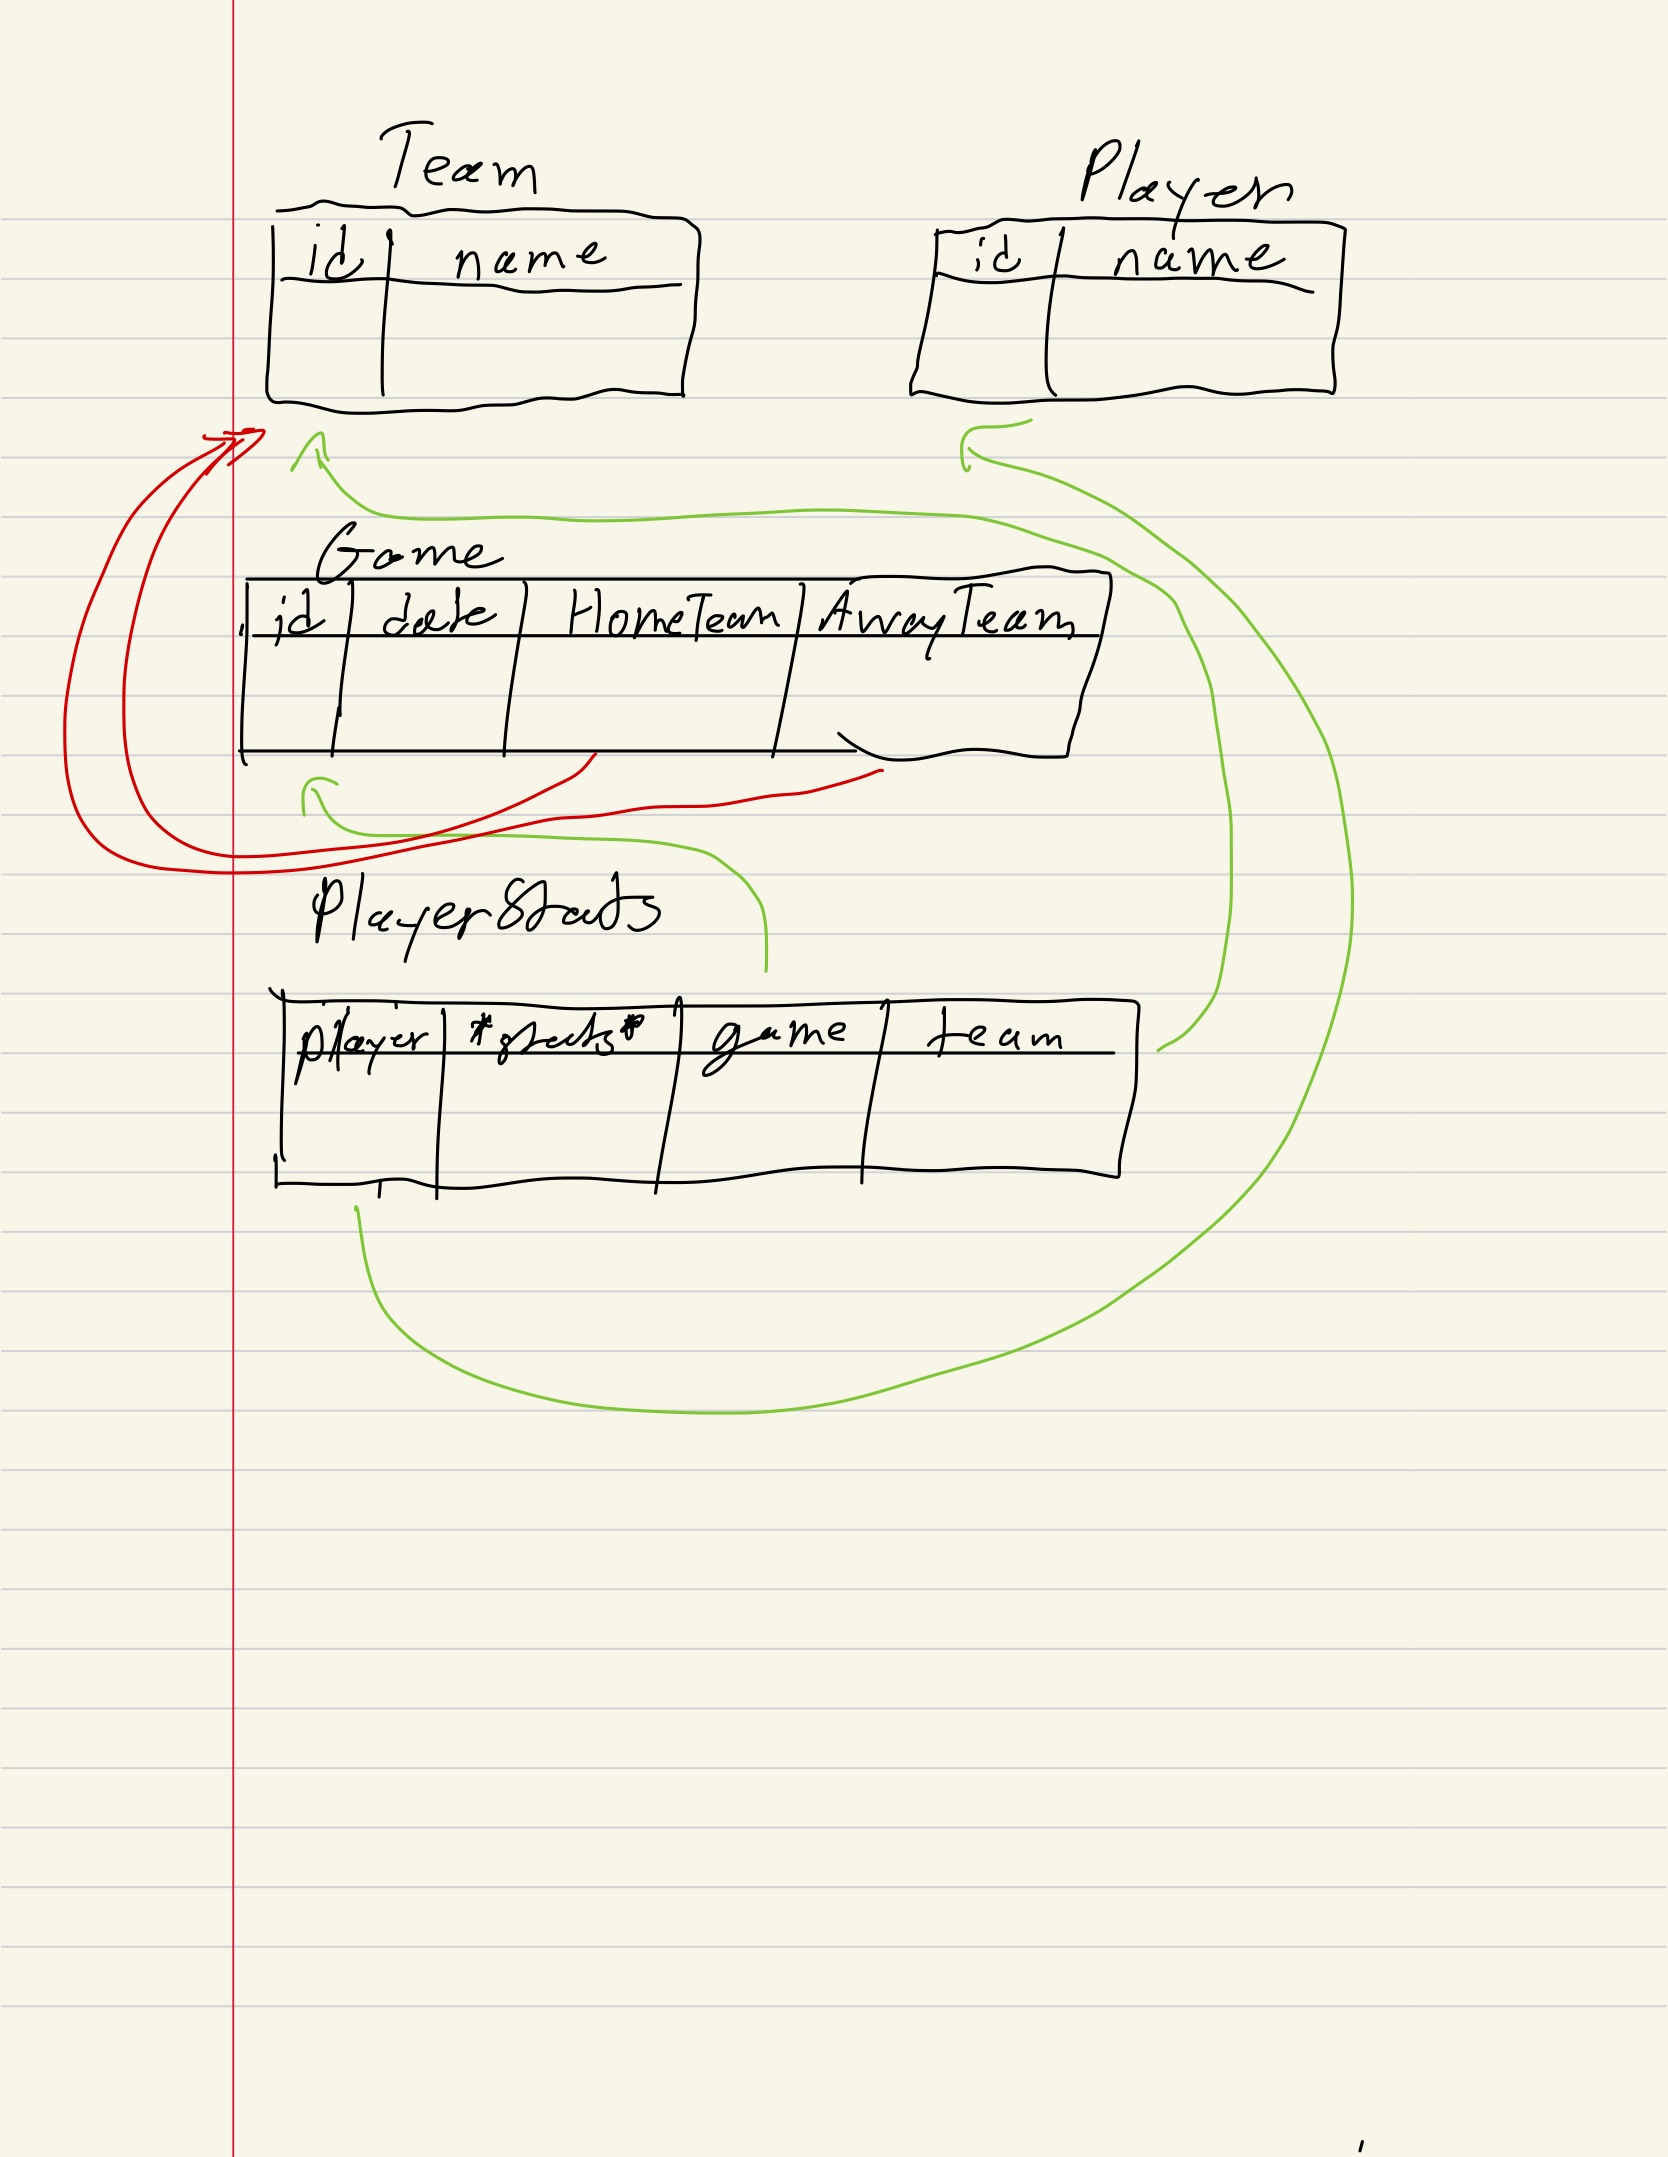
The architecture includes four main tables: Player, Team, Game, and PlayerStats.
- Player — This table stores information about individual players, with fields for a unique identifier (id) and the player's name (name).
- Team — This table holds data about different teams, also with an id and name field, ensuring each team is uniquely identifiable.
- Game — This This table records details of games played, including a unique id, the date of the game, and foreign key relationships to identify the home_team and away_team. The foreign key constraints ensure referential integrity by linking each game to two entries in the Team table.
- PlayerStats — This table captures detailed statistics for players in each game. It includes a foreign key to the Player table (player), a foreign key to the Team table (team), and another to the Game table (game), linking player performance to specific games and teams. Additional fields record whether the player was a starter (is_starter), minutes played, points scored, assists, various types of rebounds, steals, blocks, turnovers, fouls, and shooting statistics (including free throws, two-pointers, and three-pointers). The shots field is a JSONField designed to store complex data about each shot taken during a game. This architecture effectively organizes and relates data necessary for tracking player performance and game outcomes within a sports context.
The schema enforces referential integrity using foreign keys and follows 3NF principles. It minimizes redundancy while supporting efficient player-level and game-level analytics.
Ingestion & ETL Process
The ingestion script (Python + Django ORM) performs:
- Parsing raw data files from
backend/raw_data - Deduplication based on composite shot identifiers
- Atomic inserts using database transactions
- Idempotent re-runs that do not re-insert existing records
- Validation and logging for debugging or data quality checks
After the ingestion process, I exported the full database state with:
pg_dump -U okcapplicant okc > dbexport.pgsqlPlayerSummary API
The PlayerSummary API aggregates player identity info, game-level performance, and all shot
coordinates into a single response. It mimics the structure provided in the sample_response.json.
This endpoint powers the frontend shot chart and statistical summaries.
Frontend Implementation
Player Summary Interface
Inside frontend/src/app/player-summary/, I designed a comprehensive TypeScript interface that
models the full JSON response:
- Player metadata
- Array of games played
- Shot attempts with
{ x, y, made, gameId } - Computed stats such as FG%, makes, misses, and game-by-game totals
Strong typing ensures that frontend logic, rendering, and API consumption remain consistent and safe.
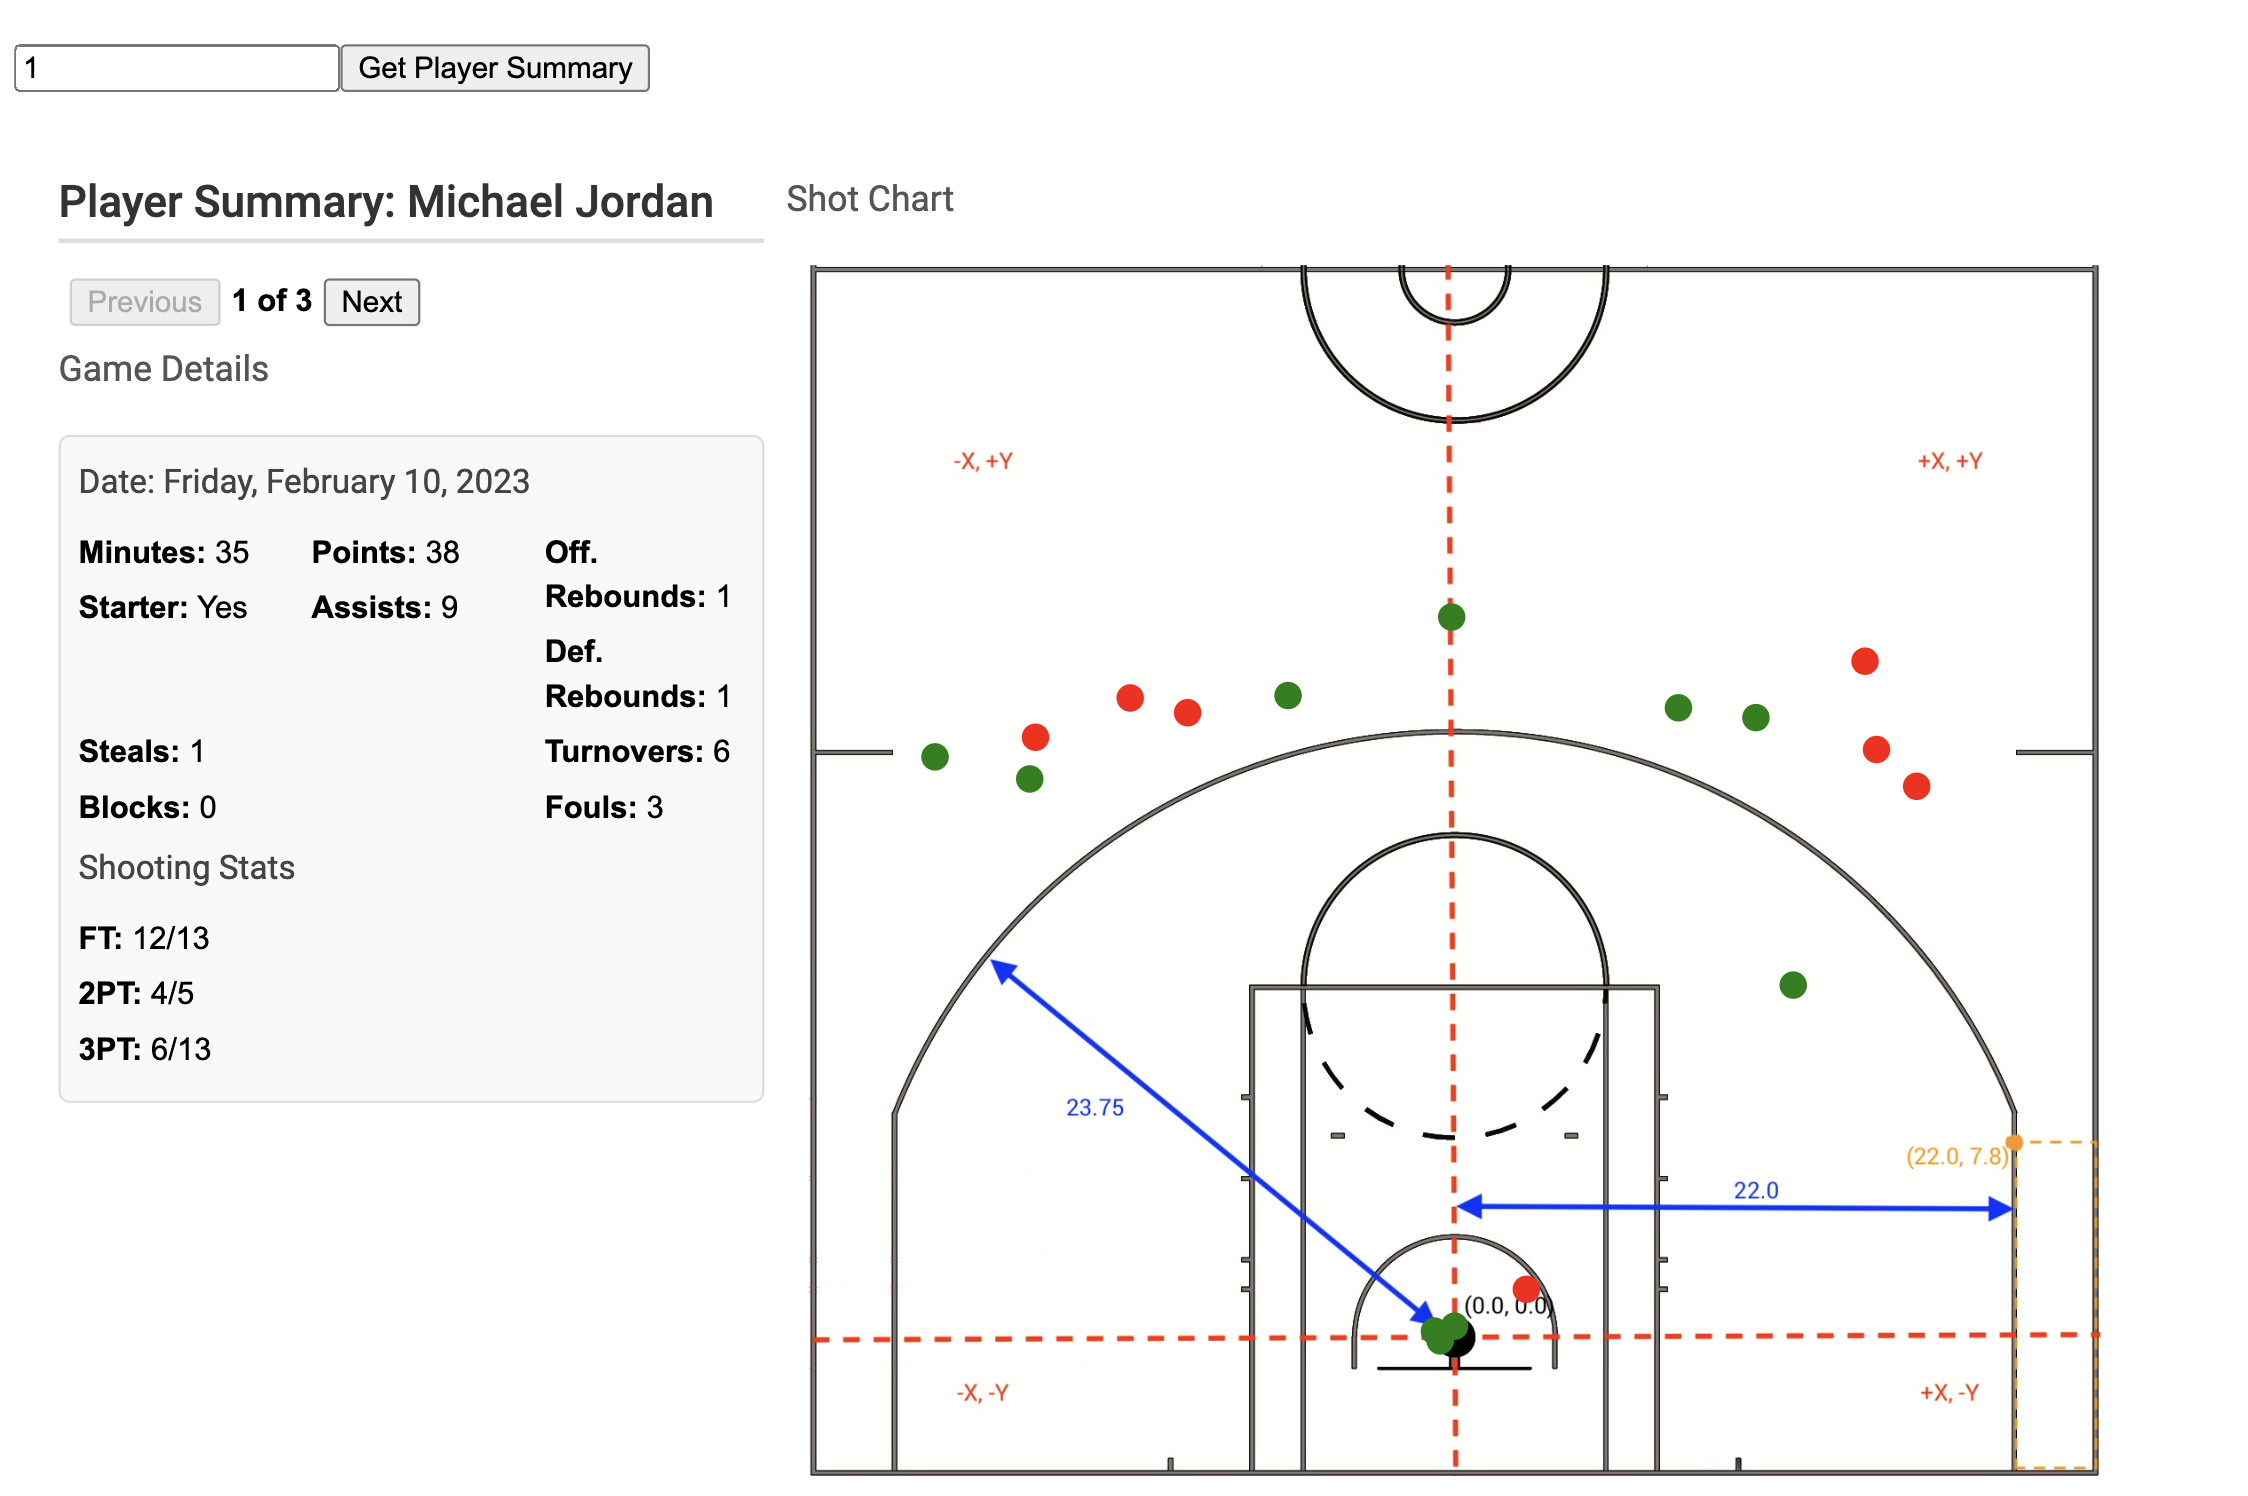
UI & Shot Chart Rendering
The Angular player-summary component:
- Extracts the
playerIDfrom the route - Fetches player summary data asynchronously
- Renders a player header with stats
- Displays a game summary table
- Draws a shot chart using coordinate transformations relative to the basket
The visualization logic converts feet-based coordinates into pixel space, maintains correct court orientation, and overlays makes/misses on top of a scalable court diagram.
Additional UX Enhancements
- Typed Angular services for communication with the backend
- SCSS-based modular styling
- RXJS Observables for reactive UI updates
- Error messaging for invalid or missing playerIDs
Overall, the frontend produces a clean, fast, interactive representation of a player's shooting data.
Tech Stack
- PostgreSQL
- Django
- Angular
- TypeScript